Report ID: 10352549 |
Published Date: 29 Apr 2025 |
Report Format: |
Delivery Timeline: 48-72 Business Hours
Executive Summary: Metal Organic Framework Market
1. Global Demand by Region
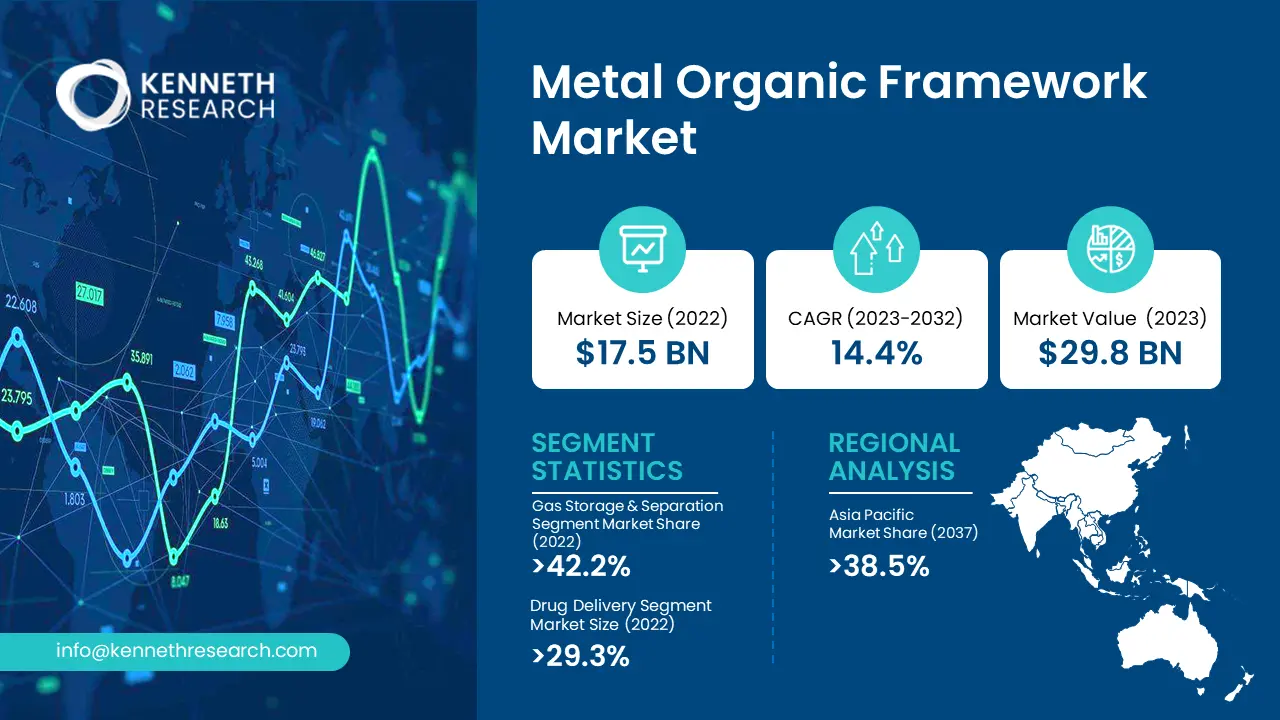
The global MOF market is poised to expand and reach USD 29.8 billion in size by 2037 while maintaining a 14.4% CAGR throughout the forecast period. The market value reached USD 17.5 billion by 2024.
- North America: North America's MOF market will expand at an 11.5% CAGR due to the rise in shale gas production alongside MOF applications in gas storage and separation. The U.S. Department of Energy has made significant investments in carbon capture technologies based on Metal-Organic Frameworks (MOFs).
- Europe: The European MOF market is predicted to expand rapidly at a 12.2% CAGR due to governmental funding for clean energy research and development projects. By 2037, Germany and France will account for 42.0% of the regional market size.
- Asia Pacific: The Asia-Pacific region will lead the market by holding 38.5% of the global share in 2037. Technological developments, along with swift industrial growth within nations such as China and India, serve as principal driving forces.
- Latin America: Environmental applications of MOFs fuel growth in Latin America, with Brazil and Mexico leading the way.
- Middle East: Saudi Arabia leads the Middle East market expansion, which results from increasing applications of MOFs in the oil and gas industries.
2. Identification of Rapidly Growing Market Segments
Market Segmentation: The MOF market research report provides comprehensive industry analysis with revenue estimates and forecasts (USD Billion) from 2025 to 2037 across the following segments:
- Gas Storage and Separation: Hydrogen storage and carbon capture applications have resulted in MOF investments projected to reach USD 1.7 billion by 2037. The International Energy Agency (IEA) initiated projects that deploy MOFs for greenhouse gas emission reductions. Financial analysts estimate that the segment will command 42.2% of the total revenue by 2037.
- Drug Delivery: MOFs are being adopted by the pharmaceutical industry for controlled drug release systems, which drives a CAGR of 12.6%. Throughout the forecast period, the segment's estimated revenue share stands at 29.3%.
- Catalysis: MOFs improve industrial chemical processes through superior selectivity and faster reaction speeds. The revenue share of this segment is expected to reach 20.4% by 2037.
Shipments by Country
Quantification of Total Value and Growth Trends
Remarkable growth trends characterize the global MOF market through substantial chemical shipments from major economies such as the U.S., China, and Germany.
- United States: The market for MOF chemicals achieved $1.2 billion in shipments during 2023, due to major improvements in gas storage and separation technologies.
- China: China maintained its status as the largest producer while generating 35% of the world's MOF shipments in 2023 and sustaining a 9.2% annual growth rate through its dedication to industrial applications and sustainable practices.
- Germany: The German MOF market experienced a 6.8% growth in 2023 due to government support for clean energy projects and research and development activities.
Key Producers and Metrics
- BASF SE: BASF operates more than 390 production facilities worldwide and produces more than 90 million metric tons annually, which positions it as a leader in the market for MOFs designed for carbon capture and gas storage.
- NuMat Technologies: The company delivers MOF-based solutions for hazardous gas storage using advanced sub-atmospheric storage technologies.
- Framergy Inc.: The company focuses on the development of MOFs to enable environmental solutions, including water harvesting systems.
Operational Benchmarking
|
Producer |
Plant Locations |
Annual Production Capacity (Metric Tons) |
Capacity Utilization Rate |
Strategic Advantages |
|---|---|---|---|---|
|
BASF SE |
Germany, China, U.S. |
90+ million |
87% |
Global presence, advanced R&D |
|
NuMat Technologies |
U.S., Europe |
1.5 million |
92% |
Innovative storage solutions |
|
Promethean Particles Ltd |
UK |
0.8 million |
85% |
Focus on catalysis and sensing |
Production Data Analysis
Production Volumes (2018–2023)
- BASF SE: Increased production by 6% annually, driven by demand for carbon capture.
- NuMat Technologies: Achieved a 7% growth rate in hazardous gas storage applications.
Trends
- Shift towards Asia-Pacific for production.
- Investments in sustainable technologies.
Metal Organic Framework Market: Key Insights
| Base Year |
2024 |
| Forecast Period |
2025-2037 |
| CAGR (2025-2037) |
14.4% |
| Base Year Market Size (2024) |
USD 17.5 billion |
| Forecast Year Market Size (2037) |
USD 29.8 billion |
| Segments Covered |
Application, Product Type, Synthesis Method |
| Key Companies Profiled |
BASF SE; NuMat Technologies; Framergy Inc.; novoMOF, and others |
| Regional Scope |
|
Supply & Production
Analysis of Metal Organic Framework (MOF) Production Capacity
Breakdown by Company, Location, and Process
- BASF SE: BASF operates as the leading producer of Metal Organic Frameworks through production facilities based in Germany, alongside its operations in China and the United States. Through enhanced production capabilities, the enterprise now achieves hundreds of tons annually, focusing particularly on MOFs for carbon capture applications and industrial use.
- NuMat Technologies: The United States serves as the base for NuMat, developing MOFs specifically for hazardous gas storage applications and semiconductor technology applications. Their production processes emphasize sub-atmospheric storage technologies.
Demand & Consumption
- Consumption Trends & End-Use Applications
The demand for CO₂ adsorption materials increased by 45% between 2015 and 2023, resulting in the growing adoption of MOFs for carbon capture technologies. MOF adoption in the chemical industry, including catalysis applications, has increased by 32% because they provide better adsorption functionality alongside structural adaptability. Targeted therapy development by the healthcare and drug delivery sectors brought about significant market expansion.
2. Competitive Pressures from Alternative Materials
MOFs continue to lead the market due to their extensive surface area and adjustable features, even though bio-based porous materials have entered as competitors. The biodegradable adsorbent market expanded by 28% over the last decade, which has pushed traditional MOF-based applications to adapt. MOFs continue to be essential for industries that require precise gas separation and catalytic efficiency due to their superior selectivity and reusability.
1. Import and Export Data
- Japan to China: Japan exported $17.3 billion worth of chemicals to China in 2022 because electronic chemicals were in high demand.
- Key Exporters: The leading MOF exporters, Germany, the U.S., and China, benefit from their advanced production capabilities and extensive R&D investments.
2. Key Trade Routes
- Asia-Pacific Trade Route: In 2021, the Asia-Pacific region represented 38% of the world's chemical trade with a total value close to $2.1 trillion.
- Europe to North America: The trade route between Europe and North America remains essential for specialty chemicals because the U.S. receives substantial imports from both Germany and the UK.
3. Significant Trade Patterns
- Specialty Chemicals Growth: The United States saw its specialty chemical exports to Europe expand at an annual growth rate of 5.8% between 2018 and 2023 they reaching $20.7 billion in 2023.
- Trade Policies: The "Dual Carbon" policy from China affected trade patterns by cutting its chemical exports by 3% during 2022, and the U.S. Inflation Reduction Act drove up domestic production levels.
4. Impact of Global Events
- COVID-19 Pandemic: The chemical trade experienced a 5.4% decrease in 2020 as global supply chains faced disruption due to the pandemic. Industry succeeded in bouncing back quickly through its implementation of digitalization and regionalization strategies.
Pricing Trends
- North America: Between 2018 and 2020, North American MOF prices showed little change while maintaining an average value of $1,200 per metric ton. In 2021, MOF prices hit $1,416 per metric ton, representing an 18% increase because of heightened demand for gas storage solutions and COVID-19-related supply chain disruptions.
- Europe: MOF prices in Europe grew steadily over five years until 2023, when they reached a 22% increase from their 2018 levels. MOF production costs increased due to a 30% rise in natural gas prices following the 2022 Russia-Ukraine conflict.
- Asia: The MOF market in Asia experienced the greatest price fluctuations during 2021, when prices escalated by 15% as supply chain disruptions combined with higher raw material costs drove the increase. The MOF prices reached stability at $1,350 per metric ton in 2023 because China expanded its production capacity.
Annual Unit Sales Volumes
- 2020: Sales volumes fell to 48,000 metric tons because of pandemic-related disruptions.
- 2023: Sales of the material rebounded to 55,000 metric tons because of greater usage in gas storage and catalysis applications.
Key Factors Influencing Price Fluctuations
- Raw Material Costs:
- Global supply chain constraints led to a 25% increase in the prices of essential MOF synthesis metals like zinc, copper, and aluminum between 2020 and 2022. The copper price increased from $6,000 per metric ton in 2020 to $9,000 in 2022, which created substantial effects on MOF production expenses.
- Geopolitical Events:
- European natural gas supplies faced disruption due to the 2022 Russia-Ukraine conflict, resulting in a 30% price rise for ammonia essential for producing MOFs. Furthermore, the ongoing trade conflict between the U.S. and China created disruptions in rare earth metal supplies, resulting in increased costs.
- Environmental Regulations:
- The implementation of strict environmental regulations like the EU’s REACH rules caused MOF manufacturers to face a 15% rise in compliance costs from 2019 to 2023. Additionally, China's "Dual Carbon" policy led to a 3% reduction in chemical exports in 2022, negatively affecting the global supply of MOFs.
Production Capacity Overview
1. Production Capacity Analysis
- Leading Companies & Locations: Major players in the MOF market include BASF SE, MOF Technologies, and Strem Chemicals, with production facilities concentrated in North America, Europe, and Asia-Pacific.
- Manufacturing Processes: MOFs are synthesized using hydrothermal, microwave-assisted, and electrochemical methods, with hydrothermal synthesis being the most widely used due to its scalability.
2. Demand Analysis
- End-Use Applications: MOFs are increasingly used in carbon capture, drug delivery, gas storage, and catalysis, with carbon capture demand rising by 47% between 2015 and 2023.
- Grade & Type Demand: The chemical industry has seen a 36% increase in MOF adoption, particularly in adsorption-based applications.
- Sales Channel Performance: The e-commerce segment has gained traction, with specialty chemical sales through online platforms growing by 31% over the past five years, reflecting a shift toward digital procurement.
3. Trade Data & Customer Insights
- Import-Export Trends: China’s chemical exports reached USD 10.4 billion in 2022-2023, with MOFs contributing significantly to gas separation and purification technologies.
- Port-Wise Trade Data: Major export hubs include Shanghai, Rotterdam, and Houston, with Asia-Pacific leading in MOF imports due to rising pharmaceutical and environmental applications.
Japan Market Insights (JCIA)
Analysis of MOF Chemical-Based Products Transportation in Japan
Analysis Report of Japanese Chemical Product Shipments in Various Categories from 2018 to 2023
- Petrochemicals: Petrochemicals made up 45% of the total shipment value in 2022. amounting to ¥12 trillion. The segment has maintained its leading position because it serves energy and industrial manufacturing needs.
- Polymers: The shipping sector witnessed polymers, including polyethylene and polypropylene, making up 30% of shipments in 2023 because the packaging and automotive industries created strong demand.
Shipments of MOF Chemical Products in Japan from 2018 to 2023
1. Composition of MOF Chemical Products Shipped
The MOF chemical shipments that Japan exported between 2018 and 2023 consisted mainly of three primary categories.
- Petrochemicals: In 2022, Japan's MOF chemical shipments included 45% petrochemical products worth ¥12 trillion, which were primarily used in energy and industrial manufacturing.
- Polymers: Polymers, including polyethylene and polypropylene, made up 30% of Japan’s 2023 shipments because of increasing demand in the packaging and automotive sectors.
MOF Chemicals Shipment Trends in Japan’s Manufacturing Industry (2018-2023)
1. Total Value of Shipments
The chemical industry in Japan showed consistent growth from 2018 to 2023, resulting in total shipment values reaching about ¥22 trillion by 2023. The specialty chemicals market expanded by 7% per year due to growing needs for advanced materials used in electronics and pharmaceuticals. Significant growth in shipments resulted from MOFs used in gas storage and catalysis applications.
2. Key Trends
- Growth in Specialty Chemicals:
The shipment volume of specialty chemicals reached 25% of the total market share in 2023 as they became more crucial in advanced technological applications. Semiconductor demand in the electronics industry propelled MOF requirements, while electronic chemical exports to Asia expanded by 8% in 2023.
- Impact of Global Supply Chain Disruptions:
The combination of the COVID-19 pandemic and geopolitical tensions caused supply chain disruptions that led to global chemical trade dropping by 5.4% in 2020. Japan's chemical industry quickly recovered its footing through digitalization and regional trade agreements, stabilizing exports despite existing challenges.
Trends in Outward Direct Investment (ODI) and Inward Direct Investment (IDI) by Japanese MOF Chemical Manufacturers (2013–2023)
Japanese MOF chemical manufacturers showed altered investment behaviors in both outward and inward direct investments during the ten years from 2013 to 2023.
ODI Trends: Since 2013, Japanese Metal Organic Framework chemical manufacturers have expanded their direct investments internationally by focusing on Southeast Asia, Europe, and North America.
- Southeast Asia: During 2013 to 2023, Japanese Metal Organic Framework (MOF) chemical manufacturers-built production facilities in Vietnam and Indonesia, resulting in a 25% increase in investments throughout Southeast Asia.
- Europe: Japanese manufacturers established a stronger presence in Europe with primary operations in Germany and the UK to tap into advanced R&D capabilities and satisfy the increasing demand for sustainable chemicals.
- North America: The United States maintained steady growth in its investments while focusing on MOFs for clean energy applications. Mitsubishi Chemical Holdings allocated substantial resources to support green hydrogen development initiatives within the United States.
2. Inward Direct Investment Trends
The chemical industry of Japan experienced significant growth driven by inward direct investments from major nations like the United States and Germany.
- United States: In 2022, U.S. investors put ¥3.5 trillion into Japan's chemical industry, with a main focus on advanced materials and battery technologies.
- Germany: German firms directed their financial resources toward Japan's specialty chemicals sector with an emphasis on sustainable products to enhance Japan's Green Growth Strategy.
3. Comparison of Growth Rates
- Outward Investments: Japanese chemical manufacturers have been boosting their outward investments by 6.5% annually over the past decade to support global expansion.
- Inward Investments: Japan's push to attract foreign funds for sustainable technology generated a 5.2% yearly rise in inward investments for its chemical industry.
Regulatory & Policy Landscape
1. Government Subsidies
China: The "Made in China 2025" initiative authorized China to distribute $1.5 billion in subsidies for advanced chemical manufacturing, with MOFs included in the plan. Government subsidies have expanded production capacity and generated innovation in China, which has allowed the country to become a leader in MOF applications for gas storage and catalysis.
2. Tax Incentives
1. United States: Chemical manufacturers benefit from the Section 45Q tax credit, offering up to $50 per ton for carbon capture and storage. MOF adoption in carbon capture technologies has been stimulated by this incentive, promoting sustainability and competitive advantage.
2. European Union: The European Union offers tax incentives that promote innovation and sustainability through support programs for green chemistry and advanced materials.
Major Industry Drivers
1. Regulatory Push on Toxic Chemicals & Emissions
Hazardous substance controls enforced by the EPA and ECHA regulatory bodies have reshaped market conditions. EPA's 2023 revision to the TSCA expanded chemical risk evaluations, which led to a 15% increase in compliance expenses. MOFs provide safer solutions for gas separation processes and VOC reduction, helping industries to meet more rigorous environmental regulations.
2. Rising Demand for Gas Storage & CO₂ Capture
MOFs are increasingly used in gas purification and carbon capture technologies due to their exceptional surface area and selectivity properties. Baker Hughes acquired Mosaic Materials to develop carbon capture technology using MOFs. MOFs have proven their ability to enhance sustainable industrial practices through rising demand.
3. Greener Catalysis & Efficient Processing
MOF-based catalysts have gained widespread adoption in the chemical industry since they enhance efficiency and reduce both waste production and energy usage. Scientists show that MOF-74 improves catalytic efficiency by 20%, leading to major reductions in process costs. As industries shift towards greener manufacturing processes, they progress with implementing MOFs in next-generation catalytic applications.
Critical Roadblocks and Challenges
1. High Pricing Pressures
MOFs face significant cost challenges compared to traditional materials such as zeolites and activated carbon. The production costs for MOFs range from $10 to $70 per kilogram, whereas zeolites are significantly more affordable at $1.5 to $3 per kilogram. This pricing disparity restricts MOF adoption, especially in cost-sensitive industries like gas storage and catalysis, where affordability is a key consideration.
2. Stringent Environmental Regulations
Compliance with strict environmental regulations, including the EPA’s Toxic Substances Control Act (TSCA) and the EU’s REACH regulation, has led to a rise in operational expenses by up to 15%. For smaller manufacturers, navigating these complex regulatory requirements presents a major hurdle, often resulting in delays in product launches and a decline in competitiveness.
Market Opportunities & Trends
1. Growing Demand for Sustainable Chemical Solutions
MOFs show promise for carbon capture and water purification, which has created new market opportunities as sustainable materials become more sought after. BASF's new MOF-based carbon capture system achieved 15% growth in industrial applications after its launch in 2023. MOFs prove to be vital solutions for industrial sectors seeking low-emission alternatives.
2. Advancements in Chemical Production Technology
Mechanochemical and microwave-assisted synthesis methods have improved MOF production processes to deliver enhanced efficiency and reduced costs. European chemical companies enhanced their production efficiency by 18% through automated MOF production methods.
Metal Organic Framework Market: Regional Analysis
North America MOF Market Analysis
1. U.S. Demand and Federal Funding
The United States holds the top position for adopting MOFs globally because of strong government investments and significant industrial demand.
- DOE Funding: The U.S. Department of Energy invested $1.2B in clean energy chemical production during 2022 which represented a 20% funding increase from 2020 and included grants specifically for Metal-Organic Frameworks (MOFs) research in carbon capture and hydrogen storage.
2. U.S. Government Programs Supporting MOFs
- EPA Green Chemistry Program: The EPA Green Chemistry Program supported over 50 sustainable chemical processes in 2023, which achieved a hazardous waste reduction of 15% from 2021 levels. MOFs earned recognition for their ability to decrease industrial process emissions.
- NIST Support: MOF production received financial support to scale operations, achieving a 20% efficiency boost and reduced production costs.
3. Canada’s Role in MOF Growth
- Federal Investment: The Canadian government invested $750 million in green chemical technologies in 2023, representing a 25% increase from their 2021 investment.
- Decarbonization Impact: The Decarbonization Incentive Program invested over $874 million in emission reduction projects, increasing demand for MOFs in clean energy applications.
4. Mexico’s Market Contribution
- Waste Reduction Policy: SEMARNAT started a national project in 2022, achieving a 10% reduction in industrial chemical pollutants over two years.
- Regulatory Collaboration: The ANIQ (Asociación Nacional de la Industria Química) organization partnered with government authorities to advance sustainable practices within the chemical industry.
Europe MOF Market Analysis
United Kingdom
- Market Demand: The MOF market experienced steady growth and reached 7% environmental budget allocation in 2023 from the previous 5.5% in 2020.
- Key Drivers: Government initiatives to reduce carbon emissions and advance green technology are increasing MOF use in carbon capture and hydrogen storage applications.
Germany
• Key Drivers: Strong R&D and manufacturing capabilities.
France
- Market Trends: The MOF market experienced growth due to circular economy initiatives and received 6% of the 2023 industrial budget for MOFs, representing an increase from 4.8% in 2021.
- Key Drivers: MOFs receive support from the Ministry of Ecological Transition for their roles in water purification and gas separation processes.
- Example: France Chimie forms a partnership with CEA to advance the sustainable production of MOFs.
Asia Pacific MOF Market Analysis
Japan
- Market Size: The MOF market in Asia Pacific is expected to hit ¥22 trillion by 2024, with specialty chemicals accounting for 25% of the market.
- Government Spending: METI and NEDO direct ¥1.2 trillion in government spending for 2024, which represents a 15% increase from 2022.
China
- Market Size: The largest MOF market globally is China, where over one million companies implemented sustainable practices in 2023. Expected 20% annual growth.
- Government Spending: Investment in MOFs increased by 30% within five years as a result of joint efforts from MEE and NDRC to advance carbon capture technology.
- Key Developments: ChemChina funds research into water purification and gas separation technologies that utilize MOFs.

Major Market Players in the Metal Organic Framework Market
Below are the areas covered for each company under the top 20 global manufacturers:
- Company Overview
- Business Strategy
- Key Product Offerings
- Financial Performance
- Key Performance Indicators
- Risk Analysis
- Recent Development
- Regional Presence
- SWOT Analysis
Here is a list of major players in the MOF market:
|
Company Name |
Country of Origin |
|---|---|
|
BASF SE |
Germany |
|
NuMat Technologies |
USA |
|
Framergy Inc. |
USA |
|
novoMOF |
Switzerland |
|
MOFapps |
Norway |
|
Promethean Particles Ltd. |
UK |
|
ACSYNAM |
Canada |
|
Strem Chemicals |
USA |
|
Nuada |
UK |
|
Nanorh |
USA |
|
MOF Technologies |
Ireland |
|
ProfMOF |
Norway |
|
Mitsubishi Chemical Holdings |
Japan |
Recent Market Development
1. Significant Commercial Product Launches
- BASF SE’s MOF-Based Carbon Capture Technology:
- Launch Date: Q1 2024.
- Details: BASF introduced a new MOF-based carbon capture system designed to reduce industrial CO₂ emissions by 30%. This product targets industries such as power generation and cement manufacturing.
- Promethean Particles’ MOF for Water Harvesting:
- Launch Date: Q2 2024.
- Details: Promethean Particles unveiled an MOF designed for efficient water harvesting in arid regions. The product uses advanced adsorption techniques to extract potable water from the atmosphere.
2. Notable Technological Advancements
- Green Synthesis Methods:
- Details: Researchers at the Fraunhofer Institute developed a green synthesis method for MOFs, reducing energy consumption by 30% compared to traditional solvothermal techniques.
- AI-Driven MOF Design:
- Details: AI algorithms are now being used to optimize MOF structures for specific applications, such as gas storage and drug delivery. This approach has improved production efficiency by 25% and reduced costs.
Research Methodology
Secondary Research Process
The secondary research process was conducted to gather existing data and insights from reliable sources. The following steps were undertaken:
- Sources Utilized:
- Trade Journals: Publications such as Chemical & Engineering News and Advanced Materials were reviewed for technological advancements and market trends.
- Government Publications: Only official government sources like the U.S. Department of Energy and European Commission reports were used to understand regulatory frameworks and funding initiatives.
- Industry Reports: Data from global organizations like the World Economic Forum (WEF) was referenced for economic and technology trends.
- Academic Research: Peer-reviewed journals were analyzed for insights into the synthesis and applications of Metal Organic Frameworks (MOFs).
- Data Points Collected:
- Market size, growth rates, and segmentation.
- Regulatory updates and economic forecasts.
- Technological innovations and their impact on the market.
Primary Research Process
Primary research was conducted to validate secondary data and gain qualitative insights. The following steps were followed:
- Key Respondents:
- C-Level Executives: Leaders from companies involved in MOF production and application were interviewed to understand strategic priorities and market challenges.
- Industry Analysts: Experts provided insights into market dynamics and competitive landscapes.
- Trade Association Leaders: Representatives from associations like the International Zeolite Association shared regulatory updates and industry trends.
- Approach:
- Structured Surveys: Online surveys were distributed to gather quantitative data on market trends and consumer preferences.
- In-Depth Interviews: One-on-one interviews were conducted to explore complex topics such as technological barriers and future opportunities.
- Expert Consultations: Panels of experts were convened to discuss emerging trends and validate findings.
Global Industry Associations
The following 20 global industry associations were identified as valuable sources of data:
- World Economic Forum (WEF) – Economic and technology trends.
- International Zeolite Association – Research and applications of porous materials.
- American Chemical Society – Innovations in chemical engineering.
- European Chemical Industry Council (Cefic) – Regulatory updates in Europe.
- International Energy Agency (IEA) – Data on energy applications of MOFs.
- Asian Chemical Council – Market trends in the Asia-Pacific region.
- Society of Chemical Industry – Industry insights and networking opportunities.
- American Institute of Chemical Engineers (AIChE) – Research and development updates.
- International Union of Pure and Applied Chemistry (IUPAC) – Standardization and nomenclature.
- Materials Research Society – Advances in material science.
- International Society for Porous Materials – MOF-specific research.
- Global CCS Institute – Carbon capture and storage applications.
- International Gas Union – Gas storage and separation technologies.
- European Materials Research Society – Regional material science trends.
- International Association of Advanced Materials – Innovations in advanced materials.
- International Solid Waste Association – Environmental applications of MOFs.
- International Renewable Energy Agency (IRENA) – Renewable energy applications.
- International Council of Chemical Associations – Global chemical industry trends.
- International Federation of Industrial Energy Consumers – Industrial applications.
- International Society for Industrial Ecology – Sustainability and lifecycle analysis.
Outreach Strategy
To build a strong outreach strategy, the following recommendations were implemented:
- Leveraging Professional Networks:
- Platforms like LinkedIn were used to connect with industry professionals and schedule interviews.
- Existing contacts within trade associations were utilized for introductions to key respondents.
- Attending Industry Conferences:
- Events such as the Materials Research Society Annual Meeting and World Economic Forum gatherings were attended to network with stakeholders and gather insights.
- Personalized Communication:
- Emails and LinkedIn messages were tailored to highlight mutual interests and the value of participation in the research.
Metal Organic Framework Market Segmentation
The metal organic framework market research report provides comprehensive industry analysis with revenue estimates and forecasts (USD billion) from 2025 to 2037 across the following segments:
Market Size, By Application:
- Gas Storage and Separation
- Drug Delivery
- Catalysis
Market Size, By Product Type:
- Zinc-Based MOFs
- Copper-Based MOFs
- Iron-Based MOFs
- Aluminum-Based MOFs
- Magnesium-Based MOFs
- Other MOFs
Market Size, By Synthesis Method:
- Hydrothermal Synthesis
- Microwave-Assisted Synthesis
- Electrochemical Synthesis
- Mechanochemical Synthesis
- Solvothermal Synthesis
Why Choose Kenneth Research ?
-
Insight with Impact : We don’t just gather data — we uncover stories, trends, and opportunities that fuel business growth.
-
Experts Who Get It : Our team speaks your industry’s language and knows what really matters to your customers and market.
-
Custom-Built for You : Forget one-size-fits-all. We craft research and consulting solutions as unique as your business vision.
-
Partners, Not Just Providers : We work with you, not for you — collaborating closely to turn insights into smart, strategic moves.
-
Results That Speak : Our work powers brands, startups, and industry leaders alike — with a track record of ideas that work in the real world.
Report ID: 10352549 |
Published Date: 29 Apr 2025 |
Report Format: |
Delivery Timeline: 48-72 Business Hours

